
记一次线上Nacos日志优化
2021-03-22 16:55:37 卢浮宫 版权声明:本文为站长原创文章,转载请写明出处
一、前言
1.1、环境说明
目前第三方对接所有项目中的MQ已经迁移,现在是与nacos部署在统一服务器上且一直以来都是稳定运行的。
1.2、程序预警
前几天突然接收到程序预警:第三方路由更新失败。
1.3、问题原因
默认情况下nacos会产生大量的access日志,导致磁盘满载阻塞目前运行中的程序。
1.4、最终解决方案
修改nacos的日志配置
二、问题原因排查
2.1、日志信息
登录远程服务器查询日志记录,发现是MQ写入失败了。
2.2、排查MQ
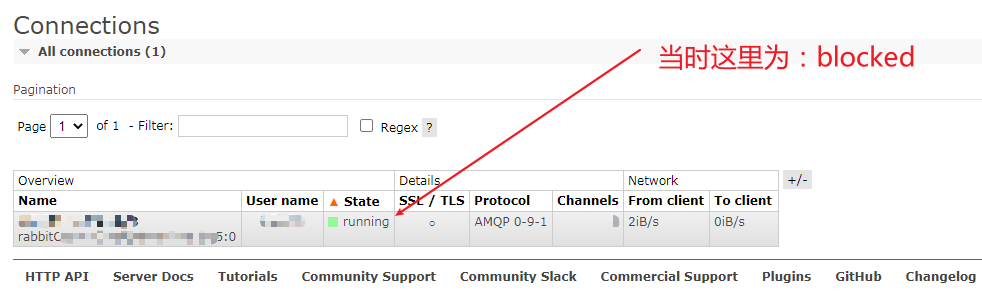
登录到mq管理后台界面发现连接阻塞了!如下:
2.3、排查服务器整体概况
这里直接登录云服务器后台监控界面,发现云盘已经使用到了100%。
PS:看到这里其实已经大致猜测出原因了,因为之前有看到nacos产生了很多日志,但是没有把任务优先级靠前处理。![[污]](http://img.t.sinajs.cn/t4/appstyle/expression/ext/normal/3c/pcmoren_wu_org.png)
三、问题紧急处理
3.1、删除日志文件
赶紧删除nacos的日志文件,腾出云盘空间。
PS:nacos的日志在bin目录下的logs下,nacos的安装目录可以通过whereis nacos来查询到
3.2、重启nacos
找到nacos的bin文件夹下执行:
① 关闭服务
./shutdown.sh
② 启动服务
./startup.sh -m standalone &
3.3、联系三方进行数据重新下发
四、最终解决过程
4.1、承接上述文字
4.2、Springboot中yml参数配置
#nacos日志控制级别调整
logging:
    level:
        com:
            alibaba:
                nacos: error
4.3、配置nacos的日志
① 文件所属位置在nacos的根目录下的conf的
application.properties
② 要修改的项大致在第98行(把true改为false)
server.tomcat.accesslog.enabled=false
③ 我这边整个文件内容如下:
#
# Copyright 1999-2018 Alibaba Group Holding Ltd.
#
# Licensed under the Apache License, Version 2.0 (the "License");
# you may not use this file except in compliance with the License.
# You may obtain a copy of the License at
#
#      http://www.apache.org/licenses/LICENSE-2.0
#
# Unless required by applicable law or agreed to in writing, software
# distributed under the License is distributed on an "AS IS" BASIS,
# WITHOUT WARRANTIES OR CONDITIONS OF ANY KIND, either express or implied.
# See the License for the specific language governing permissions and
# limitations under the License.
#

#*************** Spring Boot Related Configurations ***************#
### Default web context path:
server.servlet.contextPath=/nacos
### Default web server port:
server.port=8848

#*************** Network Related Configurations ***************#
### If prefer hostname over ip for Nacos server addresses in cluster.conf:
# nacos.inetutils.prefer-hostname-over-ip=false

### Specify local server's IP:
# nacos.inetutils.ip-address=


#*************** Config Module Related Configurations ***************#
### If use MySQL as datasource:
# spring.datasource.platform=mysql

### Count of DB:
# db.num=1

### Connect URL of DB:
# db.url.0=jdbc:mysql://127.0.0.1:3306/nacos?characterEncoding=utf8&connectTimeout=1000&socketTimeout=3000&autoReconnect=true&useUnicode=true&useSSL=false&serverTimezone=UTC
# db.user=nacos
# db.password=nacos


#*************** Naming Module Related Configurations ***************#
### Data dispatch task execution period in milliseconds:
# nacos.naming.distro.taskDispatchPeriod=200

### Data count of batch sync task:
# nacos.naming.distro.batchSyncKeyCount=1000

### Retry delay in milliseconds if sync task failed:
# nacos.naming.distro.syncRetryDelay=5000

### If enable data warmup. If set to false, the server would accept request without local data preparation:
# nacos.naming.data.warmup=true

### If enable the instance auto expiration, kind like of health check of instance:
# nacos.naming.expireInstance=true

nacos.naming.empty-service.auto-clean=true
nacos.naming.empty-service.clean.initial-delay-ms=50000
nacos.naming.empty-service.clean.period-time-ms=30000


#*************** CMDB Module Related Configurations ***************#
### The interval to dump external CMDB in seconds:
# nacos.cmdb.dumpTaskInterval=3600

### The interval of polling data change event in seconds:
# nacos.cmdb.eventTaskInterval=10

### The interval of loading labels in seconds:
# nacos.cmdb.labelTaskInterval=300

### If turn on data loading task:
# nacos.cmdb.loadDataAtStart=false


#*************** Metrics Related Configurations ***************#
### Metrics for prometheus
#management.endpoints.web.exposure.include=*

### Metrics for elastic search
management.metrics.export.elastic.enabled=false
#management.metrics.export.elastic.host=http://localhost:9200

### Metrics for influx
management.metrics.export.influx.enabled=false
#management.metrics.export.influx.db=springboot
#management.metrics.export.influx.uri=http://localhost:8086
#management.metrics.export.influx.auto-create-db=true
#management.metrics.export.influx.consistency=one
#management.metrics.export.influx.compressed=true


#*************** Access Log Related Configurations ***************#
### If turn on the access log:
server.tomcat.accesslog.enabled=false

### The access log pattern:
server.tomcat.accesslog.pattern=%h %l %u %t "%r" %s %b %D %{User-Agent}i

### The directory of access log:
server.tomcat.basedir=


#*************** Access Control Related Configurations ***************#
### If enable spring security, this option is deprecated in 1.2.0:
#spring.security.enabled=false

### The ignore urls of auth, is deprecated in 1.2.0:
nacos.security.ignore.urls=/,/error,/**/*.css,/**/*.js,/**/*.html,/**/*.map,/**/*.svg,/**/*.png,/**/*.ico,/console-fe/public/**,/v1/auth/**,/v1/console/health/**,/actuator/**,/v1/console/server/**

### The auth system to use, currently only 'nacos' is supported:
nacos.core.auth.system.type=nacos

### If turn on auth system:
nacos.core.auth.enabled=false

### The token expiration in seconds:
nacos.core.auth.default.token.expire.seconds=18000

### The default token:
nacos.core.auth.default.token.secret.key=SecretKey012345678901234567890123456789012345678901234567890123456789

### Turn on/off caching of auth information. By turning on this switch, the update of auth information would have a 15 seconds delay.
nacos.core.auth.caching.enabled=true


#*************** Istio Related Configurations ***************#
### If turn on the MCP server:
nacos.istio.mcp.server.enabled=false


###*************** Add from 1.3.0 ***************###


#*************** Core Related Configurations ***************#

### set the WorkerID manually
# nacos.core.snowflake.worker-id=

### Member-MetaData
# nacos.core.member.meta.site=
# nacos.core.member.meta.adweight=
# nacos.core.member.meta.weight=

### MemberLookup
### Addressing pattern category, If set, the priority is highest
# nacos.core.member.lookup.type=[file,address-server,discovery]
## Set the cluster list with a configuration file or command-line argument
# nacos.member.list=192.168.16.101:8847?raft_port=8807,192.168.16.101?raft_port=8808,192.168.16.101:8849?raft_port=8809
## for DiscoveryMemberLookup
# If you want to use cluster node self-discovery, turn this parameter on
# nacos.member.discovery=false
## for AddressServerMemberLookup
# Maximum number of retries to query the address server upon initialization
# nacos.core.address-server.retry=5

#*************** JRaft Related Configurations ***************#

### Sets the Raft cluster election timeout, default value is 5 second
# nacos.core.protocol.raft.data.election_timeout_ms=5000
### Sets the amount of time the Raft snapshot will execute periodically, default is 30 minute
# nacos.core.protocol.raft.data.snapshot_interval_secs=30
### Requested retries, default value is 1
# nacos.core.protocol.raft.data.request_failoverRetries=1
### raft internal worker threads
# nacos.core.protocol.raft.data.core_thread_num=8
### Number of threads required for raft business request processing
# nacos.core.protocol.raft.data.cli_service_thread_num=4
### raft linear read strategy, defaults to index
# nacos.core.protocol.raft.data.read_index_type=ReadOnlySafe
### rpc request timeout, default 5 seconds
# nacos.core.protocol.raft.data.rpc_request_timeout_ms=5000
PS: 我这边是直接把日志切掉了,但是在严谨的生产环境下还是要进行日志保留的。
五、后记
这个是一个问题发现解决的文章,更深入的探索请持续关注: